
 6447
6447
Resume Skills and Keywords for Visualisation Specialist
A Data Visualisation Specialist is responsible for transforming complex datasets into clear, interactive dashboards and visually compelling reports that support data-driven decision-making. They work with structured and unstructured data using tools like Power BI, Tableau, and SQL to design intuitive visualisations and track key performance indicators (KPIs). These professionals play a crucial role in bridging the gap between data and business teams by translating analytical insights into meaningful visual stories. They ensure data accuracy, validation, and governance while enabling stakeholders to make faster, more informed decisions. Collaborating closely with cross-functional teams, Data Visualisation Specialists optimise dashboard performance, improve reporting efficiency, and enhance user adoption. Their work directly contributes to identifying trends, improving business performance, and driving strategic outcomes.
Skills required for a Data Visualisation Specialist role:
- Dashboard Design & Development
- Power BI / Tableau
- Data Storytelling
- KPI & Metrics Development
- SQL & Data Analysis
- Business Intelligence (BI) Reporting
- ETL Concepts & Data Transformation
- Data Validation & Quality Checks
- Data Governance
- Presentation & Communication Skills
What recruiters look for in a Data Visualisation Specialist's resume:
- Bachelor’s degree in Data Science, Computer Science, or related field.
- 1–3+ years of experience in data visualisation, BI, or analytics roles.
- Hands-on experience with Power BI, Tableau, or similar tools.
- Strong SQL skills for data extraction and analysis.
- Ability to design interactive dashboards and KPI frameworks.
- Understanding of data validation, ETL processes, and reporting workflows.
- Experience working with cross-functional teams.
- Strong analytical and problem-solving skills.
What can make your Data Visualisation Specialist resume stand out:
A strong summary that highlights your ability to turn complex data into clear, actionable insights
- · A Data Visualisation Specialist with expertise in designing interactive dashboards using Power BI and Tableau, performing SQL-based analysis, and developing KPI-driven reports. Skilled in data storytelling, ensuring data accuracy, and enabling data-driven decision-making across teams.
Targeted job description
- Design and develop interactive dashboards and reports using BI tools
- Translate business requirements into visual insights and KPI frameworks
- Analyse data to identify trends and actionable insights
- Ensure data accuracy, validation, and consistency in reporting
- Optimise dashboards for performance and usability
- Collaborate with business and technical teams
- Support data governance and reporting standards
Related academic background
- B.Tech / B.Sc in Data Science, Computer Science, or related field
- Certification in Power BI / Tableau / Data Visualisation
Sample Resume of Data Visualisation Specialist in Text Format
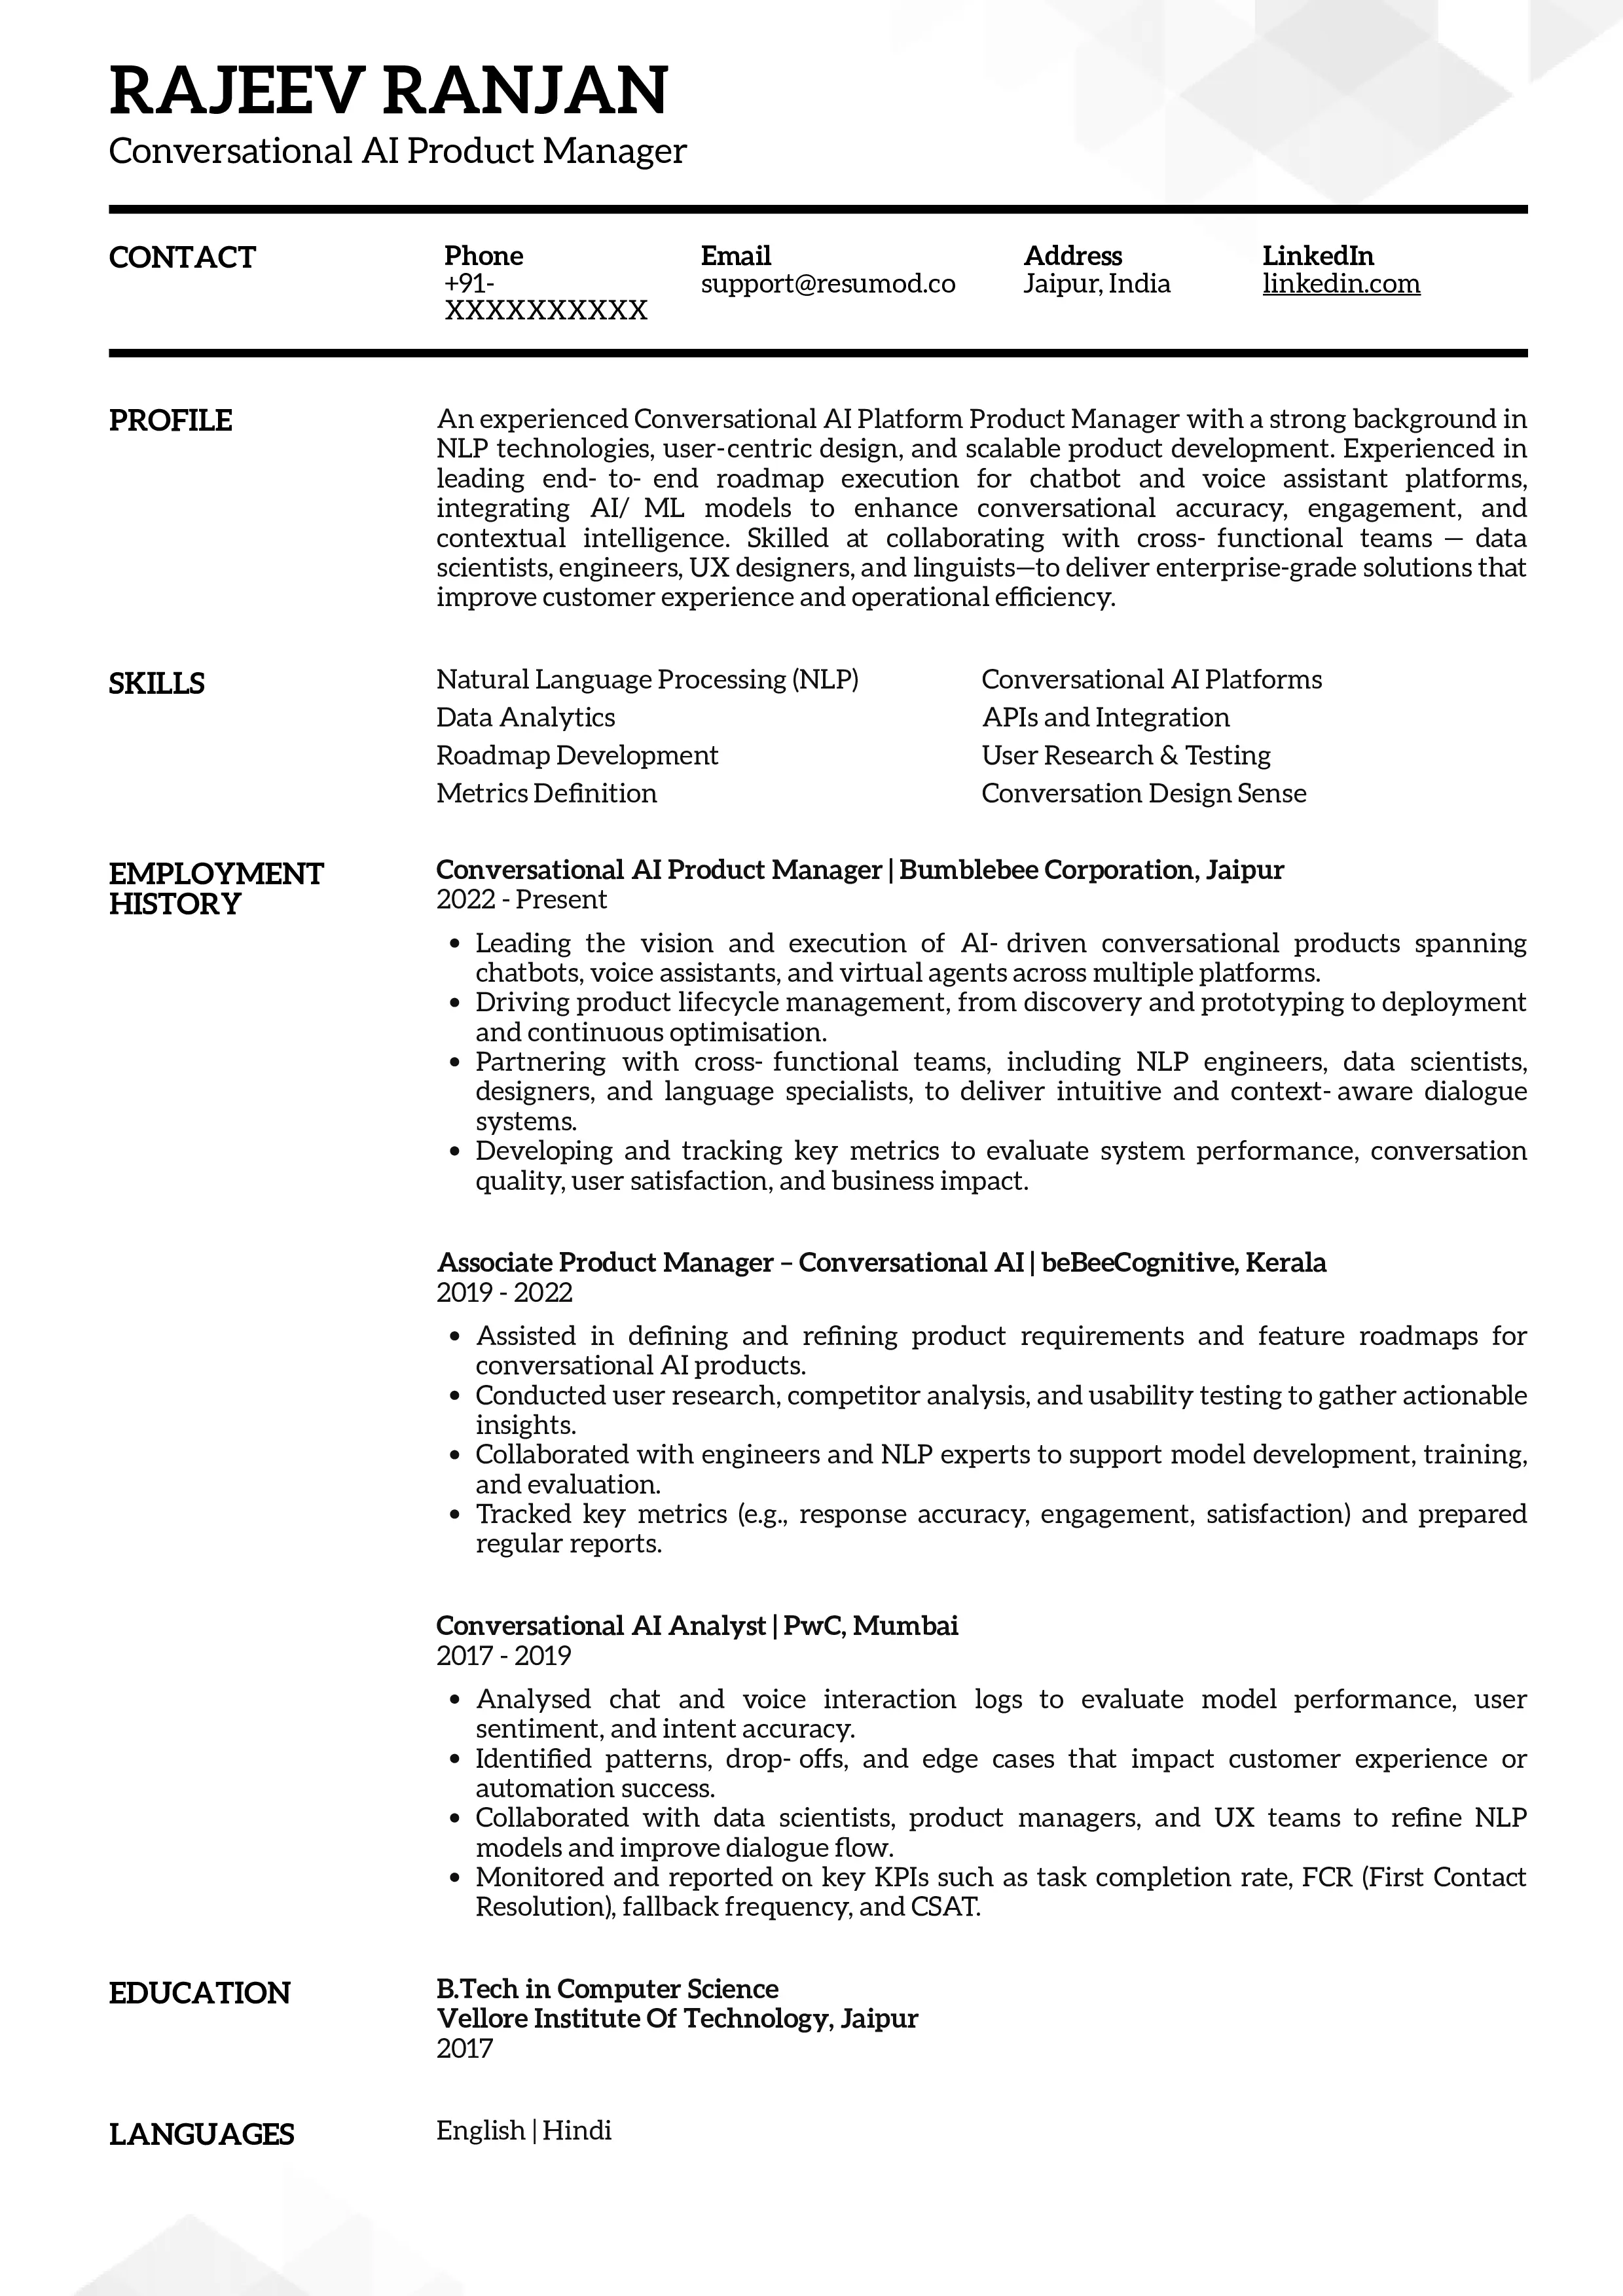
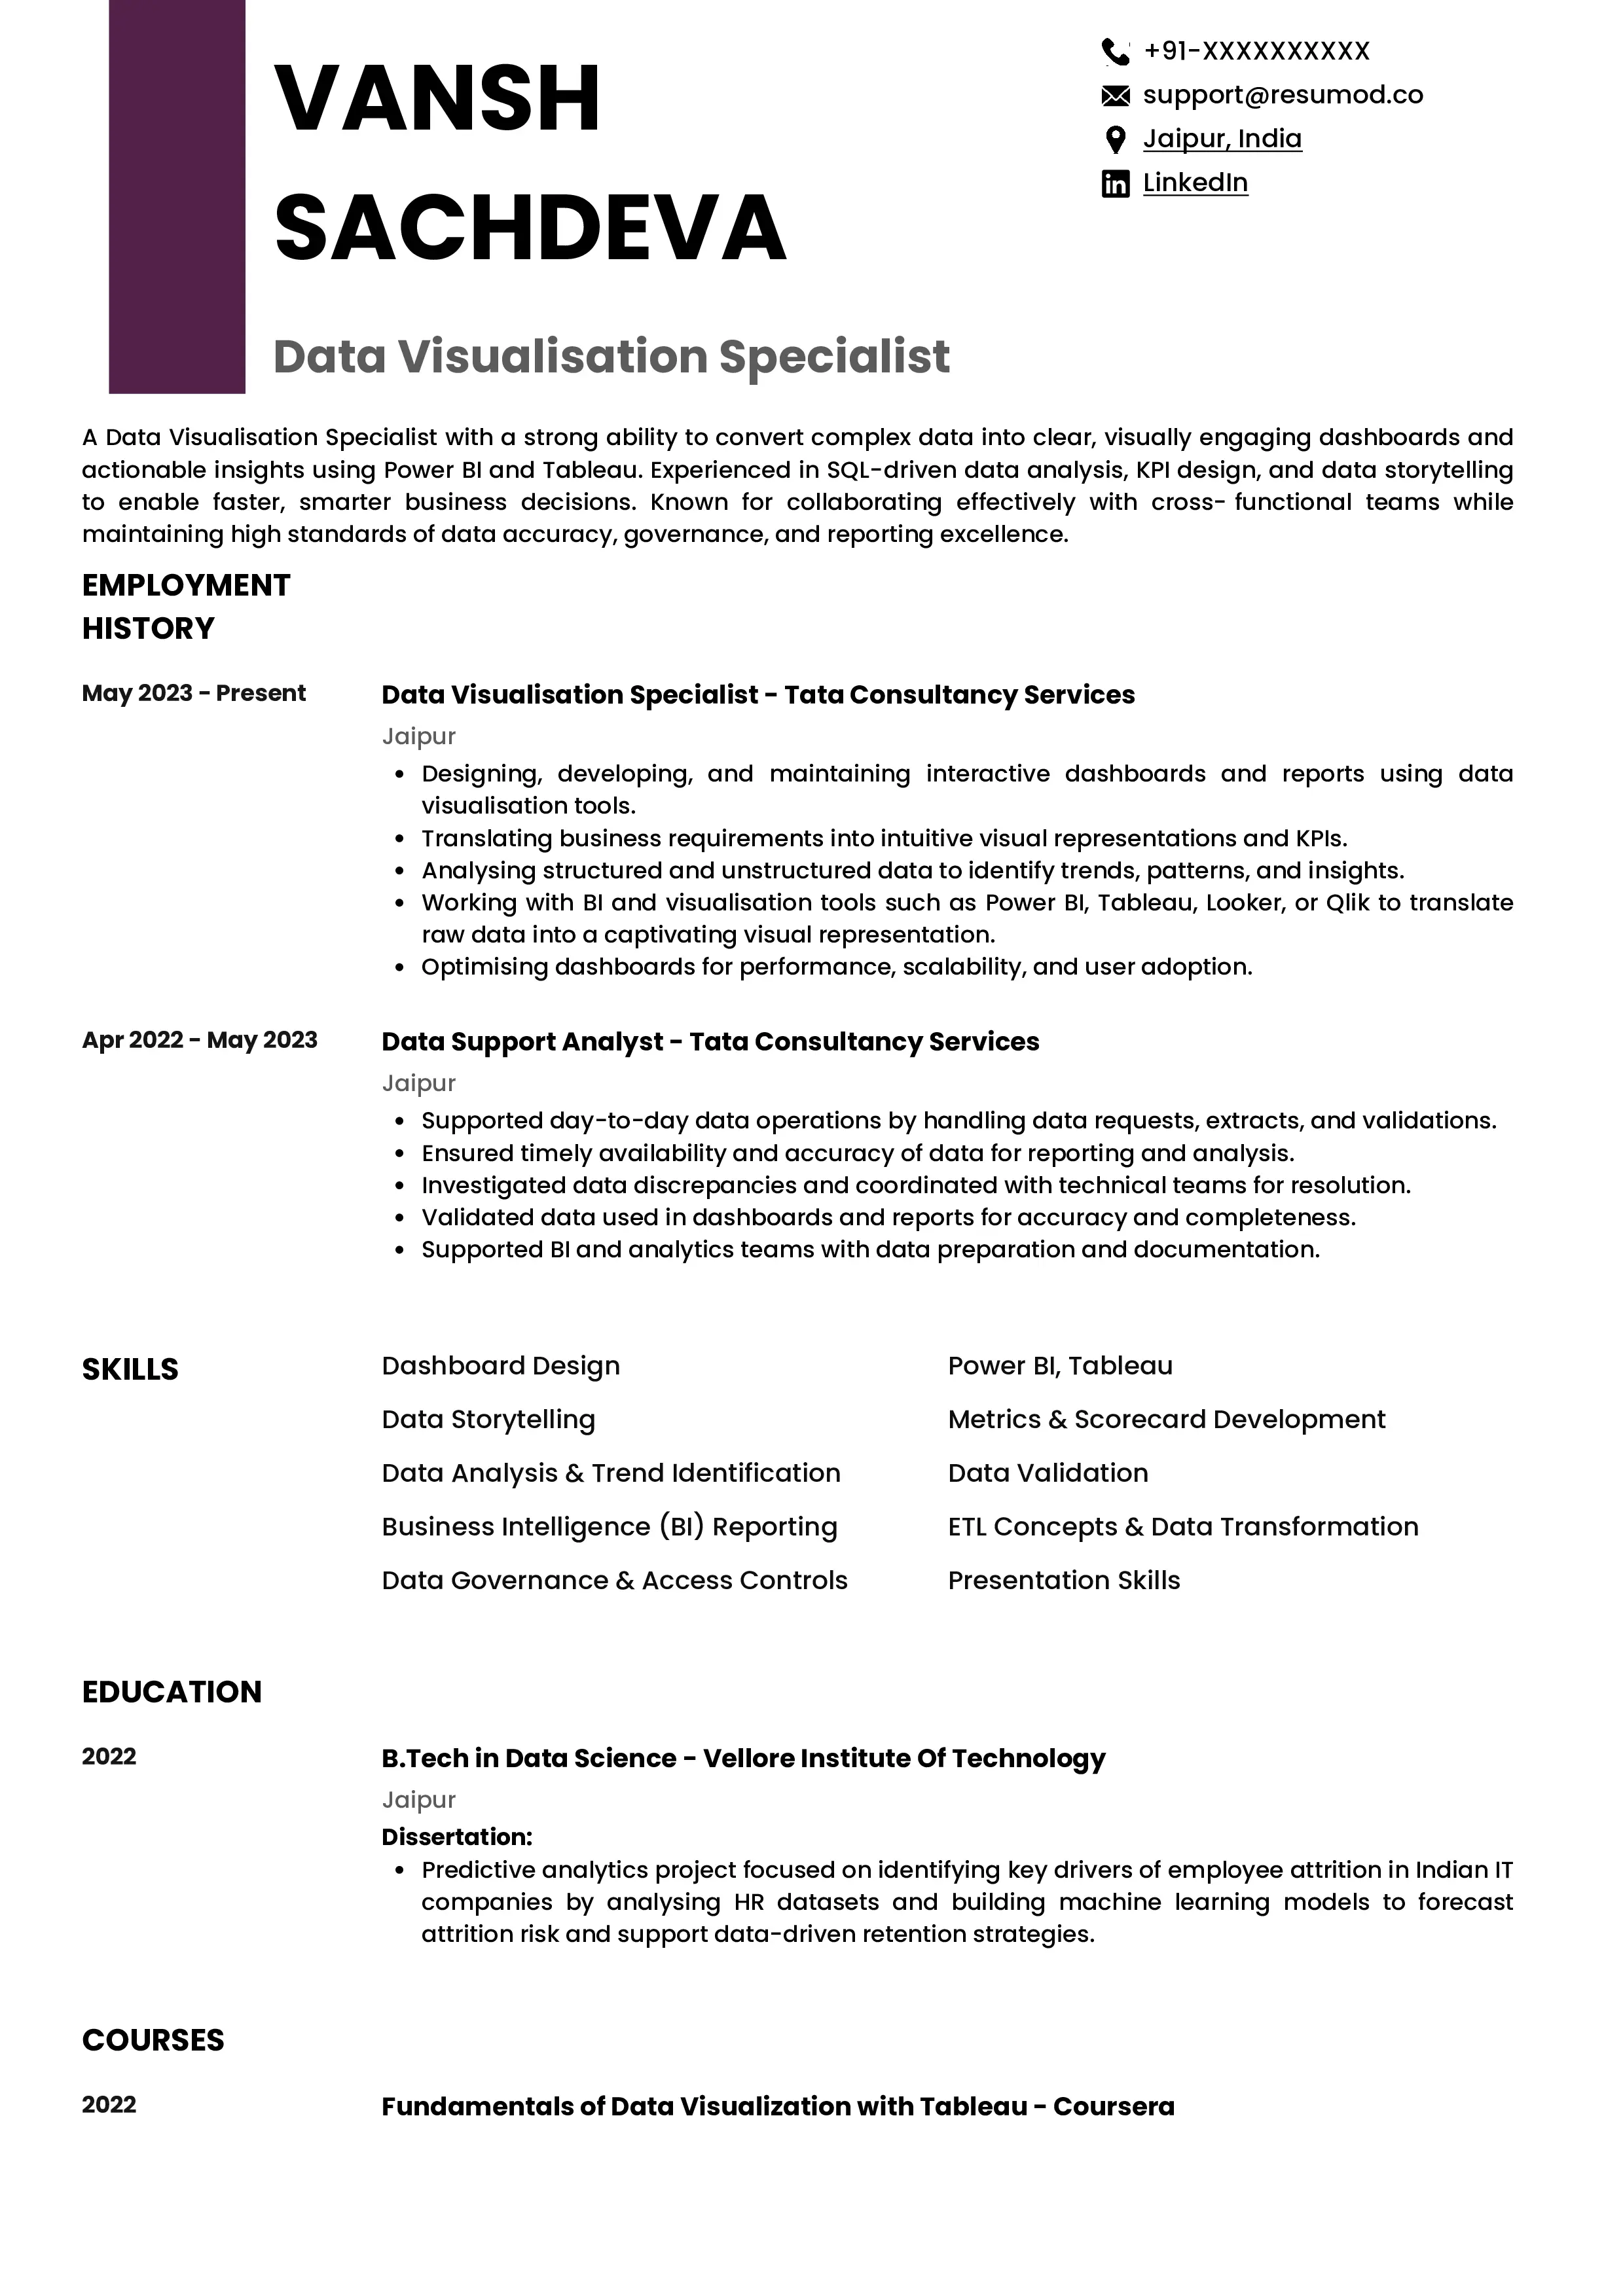
VANSH SACHDEVA
Data Visualisation Specialist
+91-XXXXXXXXXX | support@resumod.co | https://www.linkedin.com/company/resumod/
Jaipur, India
SUMMARY
A Data Visualisation Specialist with a strong ability to convert complex data into clear, visually engaging dashboards and actionable insights using Power BI and Tableau. Experienced in SQL-driven data analysis, KPI design, and data storytelling to enable faster, smarter business decisions. Known for collaborating effectively with cross-functional teams while maintaining high standards of data accuracy, governance, and reporting excellence.
EMPLOYMENT HISTORY
Data Visualisation Specialist | Tata Consultancy Services, Jaipur
May 2023 - Present
- Designing, developing, and maintaining interactive dashboards and reports using data visualisation tools.
- Translating business requirements into intuitive visual representations and KPIs.
- Analysing structured and unstructured data to identify trends, patterns, and insights.
- Working with BI and visualisation tools such as Power BI, Tableau, Looker, or Qlik to translate raw data into a captivating visual representation.
- Optimising dashboards for performance, scalability, and user adoption.
Data Support Analyst | Tata Consultancy Services, Jaipur
Apr 2022 - May 2023
- Supported day-to-day data operations by handling data requests, extracts, and validations.
- Ensured timely availability and accuracy of data for reporting and analysis.
- Investigated data discrepancies and coordinated with technical teams for resolution.
- Validated data used in dashboards and reports for accuracy and completeness.
- Supported BI and analytics teams with data preparation and documentation.
SKILLS
Dashboard Design | Power BI, Tableau | Data Storytelling | Metrics & Scorecard Development | Data Analysis & Trend Identification | Data Validation | Business Intelligence (BI) Reporting | ETL Concepts & Data Transformation | Data Governance & Access Controls | Presentation Skills
EDUCATION
B.Tech in Data Science | Vellore Institute Of Technology, Jaipur
2022
Dissertation:
- Predictive analytics project focused on identifying key drivers of employee attrition in Indian IT companies by analysing HR datasets and building machine learning models to forecast attrition risk and support data-driven retention strategies.
COURSES
Fundamentals of Data Visualization with Tableau at Coursera | 2022